

 BI / Reporting
 Analytics
 Web Design
 Graphic Design
 Online Marketing
 Contact Us
|
Data Visualization
• Power BI •
• MicroStrategy •
• Cognos Analytics •
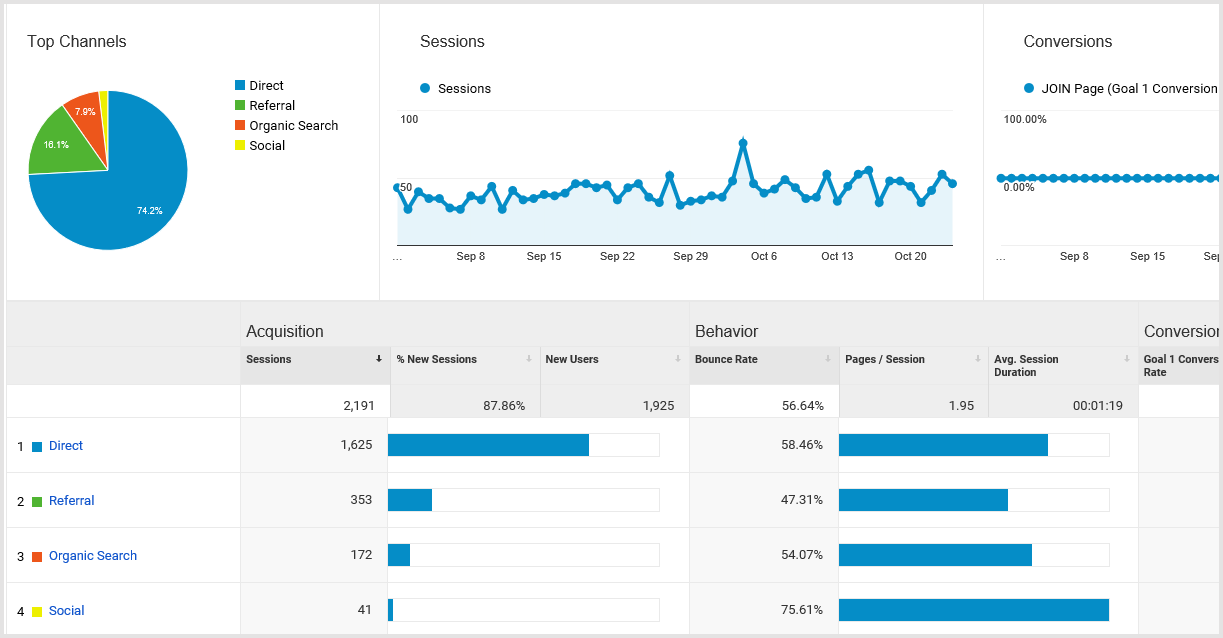
• Google Analytics •
• QlikView •
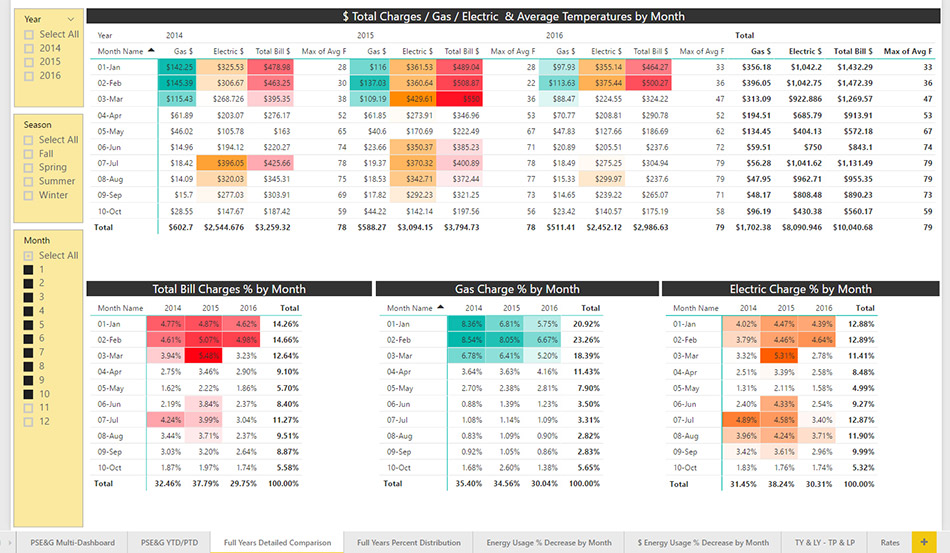
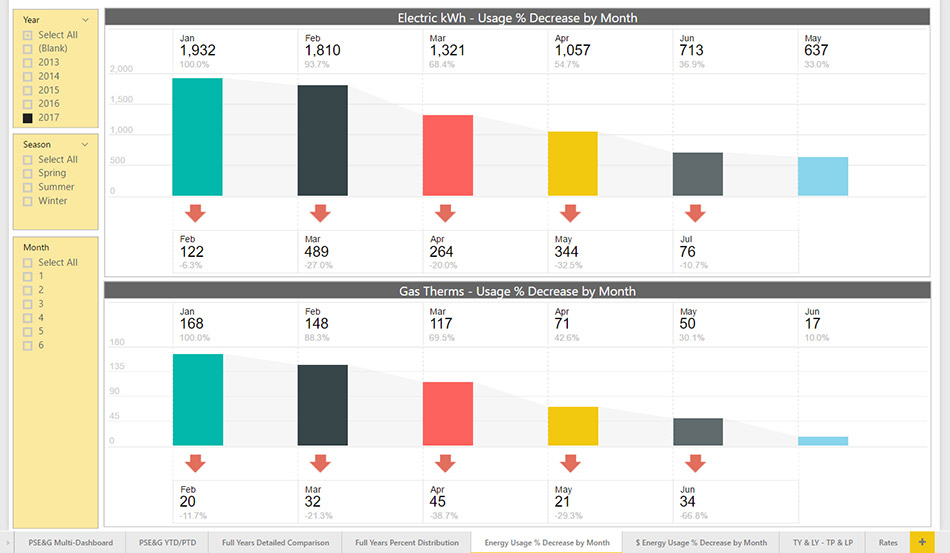
• Energy Consumption Reports and Dashboards - YTD Analysis •
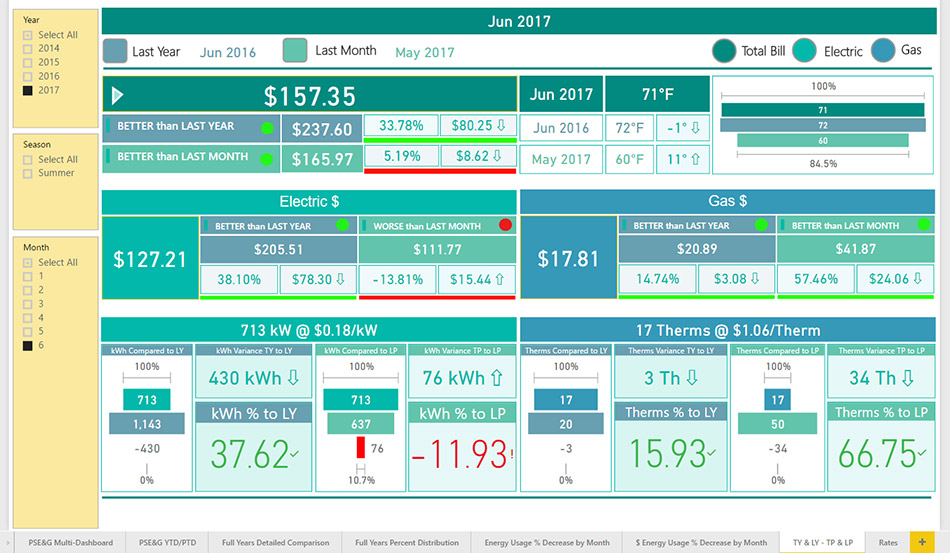
• Energy Consumption Reports and Dashboards - Monthly Energy Useage (Gas & Electric) vs LY & LM •
• Energy Consumption Reports and Dashboards - Temperature: Trends/Benchmarks •
• Energy Consumption Reports and Dashboards - Averages & % Changes •
• Energy Consumption Reports and Dashboards - Monthly Distrbutions •
• Energy Consumption Reports and Dashboards - Sankey Barchart & Usage % •
• Forecasting •
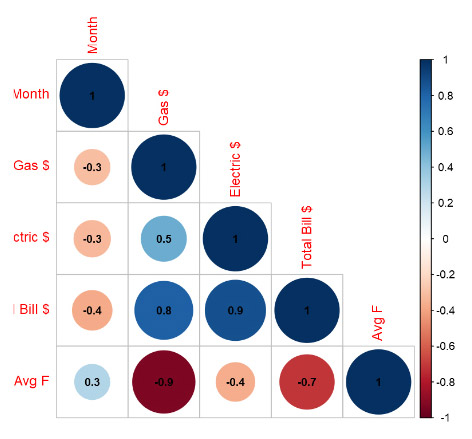
• Correlation Plot •
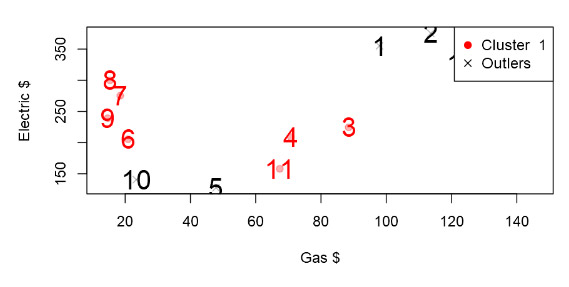
• Clustering with Outliers •
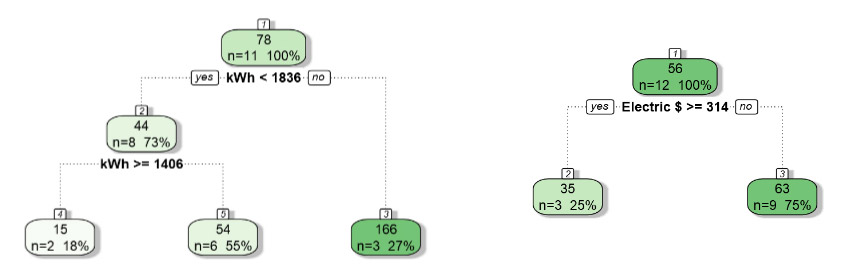
• Decision Tree •
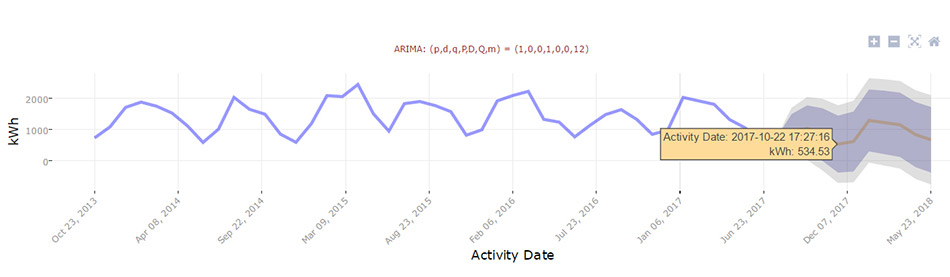
• ARIMA Charting •
• Scatter Plot •
|


URL Empire | Web Design |
BI |
Reporting |
Analytics |
Web Development |
Web Maintenance |
SEO |
SEM |
SMM |
Graphic Design |
Video Editing |
API Web Development
|